

Scientists who study the impact of melting glaciers and ice sheets have for the first time detected the fingerprint of a melting ice sheet, as it creates distinctive patterns of change to global sea levels. Newly released satellite data allowed researchers to see that changes to sea surface height near the rapidly melting Greenland Ice Sheet unambiguously fit their models. This validation, write researchers including Sophie Coulson, Ph.D. ’21, now a postdoctoral fellow at Los Alamos National Laboratory, research associate Linda Pan, and Baird professor of science Jerry Mitrovica in the September 29 issue of Science, suggests the possibility that tide gauge and satellite data can be used to improve predictions of global sea-level rise, and help identify (or at least constrain) regional sources of meltwater.
Counterintuitively, sea levels tend to fall near a melting ice sheet, and rise elsewhere around the globe. If the Greenland ice sheet melted entirely, for example, sea level would drop an estimated 20 to 50 meters near the coast. That is in part because the 3,000-trillion-ton ice sheet is so large that it exerts gravitational pull on the seas around it, which would be lost; and in part because the Earth’s crust, relieved of the weight of ice above it, would rebound, raising the elevation of land relative to the ocean. Both forces—diminished gravitational pull, and displacement of ocean water by ascending planetary crust—had been predicted to cause sea level to rise more than the global average beyond 2,000 kilometers from Greenland (For more about this and other aspects of Mitrovica’s research, read the Harvard Magazine feature article, “The Plastic Earth”).
The modern theoretical and computational modeling of these effects was pioneered in the Mitrovica lab, which rarely ventures into analysis of contemporary data. But in this case, he said in an interview, “we were lucky to work with David Sandwell,” an “important figure in what’s known as geodesy,” the study of the Earth’s shape, orientation in space, and gravitational field. Sandwell, a professor at the University of California, San Diego (and senior author of the paper), is an expert in this kind of data analysis.
Nevertheless, the effects of a melting ice sheet on sea level are difficult to detect. There is tremendous “noise” in measurements of sea surface height, caused mainly by shifting tides, currents, and winds. Water temperature and salinity also affect ocean volume, and all these dynamics must be accounted for to discern millimeter-scale changes in sea level that occur across decades. What led to the breakthrough analysis in this case was the release of satellite altimetry data (by a European marine monitoring agency) that included measurements from northerly latitudes including much of coastal Greenland. This is where the fingerprint of the island’s melting ice sheet was predicted to be most pronounced—with 10 millimeters of plunging sea-level for every millimeter that Greenland contributes to average global sea-level rise.
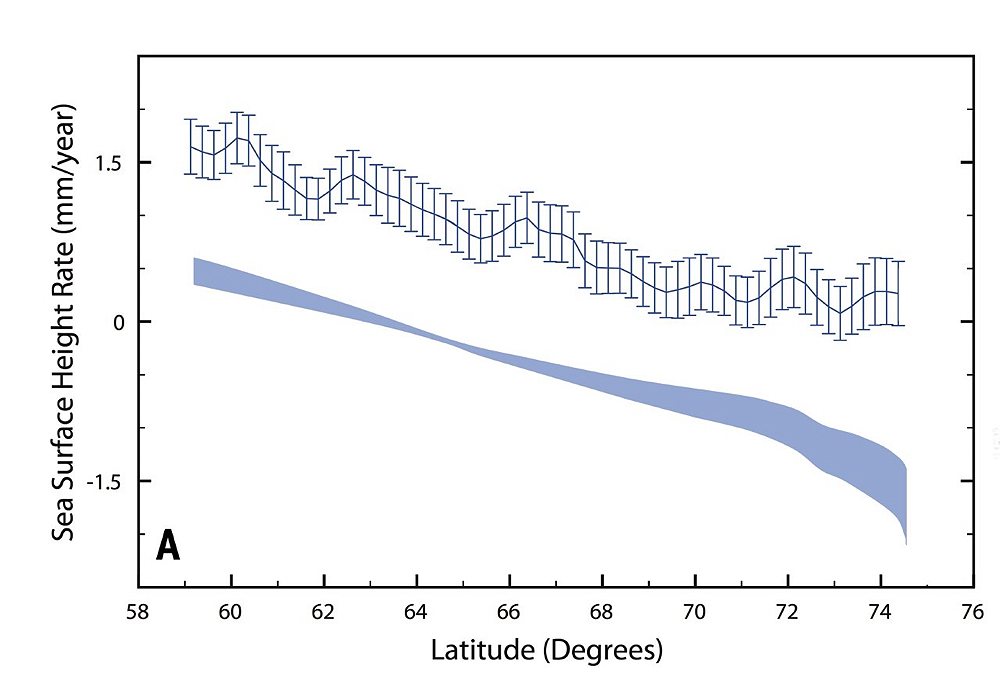
Shaded lower region shows the predicted drop in sea level near Greenland by latitude along a south to north axis. The upper line, with error bars, shows the measured drop in sea levels derived from satellite altimetry data during the period from 1993 to 2019. The trends track closely except at the highest latitudes, where the effects of the ice sheet melting are most pronounced. There, the measured sea height (upper line) does not decline as rapidly as the Greenland fingerprint model predicts. The difference between the two lines—about a millimeter—represents the growing contributions to sea level rise from melting ice elsewhere in the world, explains Mitrovica, from glaciers in Alaska to ice sheets in Antarctica.
Reprinted with permission from S. Coulson et al., Science, Volume 337:1550 (2022)
Most satellites don’t have high-polar orbits, explains Mitrovica, but a few pass occasionally above high-latitude regions like Greenland. Over time, the cumulative data from these observations, which in this case span the period from 1993 to 2019, can be used to accurately calculate long-term changes in sea level. The researchers compared the satellite observations to their modeled fingerprints of sea-level change attributable to the Greenland ice sheet for two periods: from 1993 to 2019, the full length of the altimetry dataset; and for 2002 to 2019, a period of accelerated melting. The models and observations matched for both periods, unambiguously validating decades of theoretical work.
The observed drop in sea levels near Greenland has bleak implications for coastal communities distant from this and other ice sheets, however. Seas along coastal South America, western Africa, East Asia, and Australia are already rising more rapidly than the global average.