Jeannine Cavender-Bares studies plants from space. Plants don’t just power ecosystems—they are the foundation of life, harnessing the sun’s energy to produce food, wood, and oxygen. When flowering plants and the fruits, vegetables, and grains they produce burst onto the scene 140 million years ago, they reshaped the biosphere, influencing the evolution of nearly all living organisms. Understanding plant biodiversity is therefore essential to understanding life on Earth.
That’s the motivation behind an international initiative led by Cavender-Bares, professor of organismic and evolutionary biology and director of the Harvard University Herbaria. Her team, part of the National Science Foundation-funded ASCEND project (Advancing Spectral biology in Changing ENvironments to understand Diversity), uses satellites, drones, and fieldwork to study plant function, health, and diversity. Where, for example, are the 15 billion trees lost each year disappearing fastest? What species are they, and how might their loss influence regional and global climate patterns? The effort bridges ecology, physiology, evolution, and remote sensing to create a portrait of plant biodiversity worldwide.
The 5.5 million dried plant specimens in Harvard’s Herbaria help us understand how the planet is changing today.
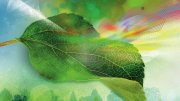
At the heart of the group’s work is spectral biology, an emerging field that uses the interaction of light with living organisms to detect chemical signatures, identify species, and assess health. When light strikes a leaf, its unique pattern of reflected and absorbed wavelengths creates a “spectral fingerprint.” Drones and handheld sensors capture this data from leaves and small stands of trees; satellites and airplanes collect it at scales ranging from forests to entire continents. These spectral signatures help researchers distinguish between drought stress and disease and to monitor ecosystems.
Why pair this high-tech work with collections of dried plants? Because plant samples preserved in herbaria—400 million specimens worldwide—carry an abundance of ecological and evolutionary information. Harvard’s Herbaria, with 5.5 million specimens, is one of the largest repositories in the world. Cavender-Bares and her colleagues are working to extract spectral data from these preserved plants to map functional traits, track changes over time, and link them to biodiversity patterns around the globe.
Since arriving at Harvard, Cavender-Bares has fielded inquiries from curators worldwide about the best way to gather spectral data from herbarium specimens. The challenge: consistency. Different instruments and methods can yield incompatible results. To address this, Harvard recently hosted a global gathering of curators, researchers, and directors—the International Herbarium Spectral Digitization (IHerbSpec) Working Group—to establish common protocols for digitizing and analyzing spectral data.
This standardization will allow researchers to build a global spectral library of plant traits. Although herbarium data won’t be directly pooled with remote-sensing data, they can help predict traits such as photosynthetic capacity, drought tolerance, and defense mechanisms against herbivores. Because herbarium specimens are abundant and carry robust information, such as the date and place of a specimen’s collection, spectral information used to predict traits, Cavender-Bares says, will provide “a lot more information about plant traits and their distributions than exists in current databases.”
Spectral data can also be used to build visual maps that track species distribution and function. For example, machine learning can combine satellite imagery with herbarium data to predict where key species or traits—like those of oaks, maples, and pines—are likely to occur across various landscapes. These models help scientists understand how plant communities evolve and respond to environmental changes.
One promising tool is a type of data visualization known as an “ordination analysis,” which groups plant communities based on shared characteristics. These can reflect functional traits (such as nitrogen content), species overlap, or evolutionary relationships (such as how closely related sugar maples native to North America are to horse chestnuts from the Balkans and to lychee trees of Southeast Asia). By linking ordinations to spatial data, researchers can translate spectral readings from space into detailed maps of plant diversity.
These data are also useful for understanding ecosystem dynamics. The Amazon rainforest, to take a prominent example, plays a key role in maintaining steady levels of regional rainfall and humidity. Spectral data can be used to uncover the links between the tropical forest’s biodiversity and its water cycling capacity, track ecosystem responses to environmental stresses over time, and inform conservation, restoration, and climate-resilience planning.
“This is where it gets exciting,” says Cavender-Bares. “Dried plant specimens stored in herbaria, which are critical for documenting humanity’s knowledge of plant diversity, turn out to be crucial for modeling and understanding the dynamics of our planet.”
“Determining the functions of all those species and their spatial distribution,” she explains, “is going to be very powerful for biosphere modeling,” the science of understanding how living systems influence and interact with the atmosphere, the sun, the soil, and our changing climate. She likens the biosphere to a living, breathing system: “You can imagine if the Earth were all cement, it would be very different than it is now: many shades of green, rooted in living soil, and absorbing and releasing water and carbon. It’s a breathing system, and herbarium specimens will ultimately help us understand the way the biosphere functions”—and shapes the planet.
